
Accessing & interacting with your charts
Historical automated scanning data lives in the Automated Scanning History tab — accessible through the Automated Scanning tab.
In this tab, you can select any data point on your chart to display a list of events that occurred since the previous data point. You can access this information in 2 ways.
From the Overview tab
- Select the website you wish to analyze and navigate to its Overview tab.
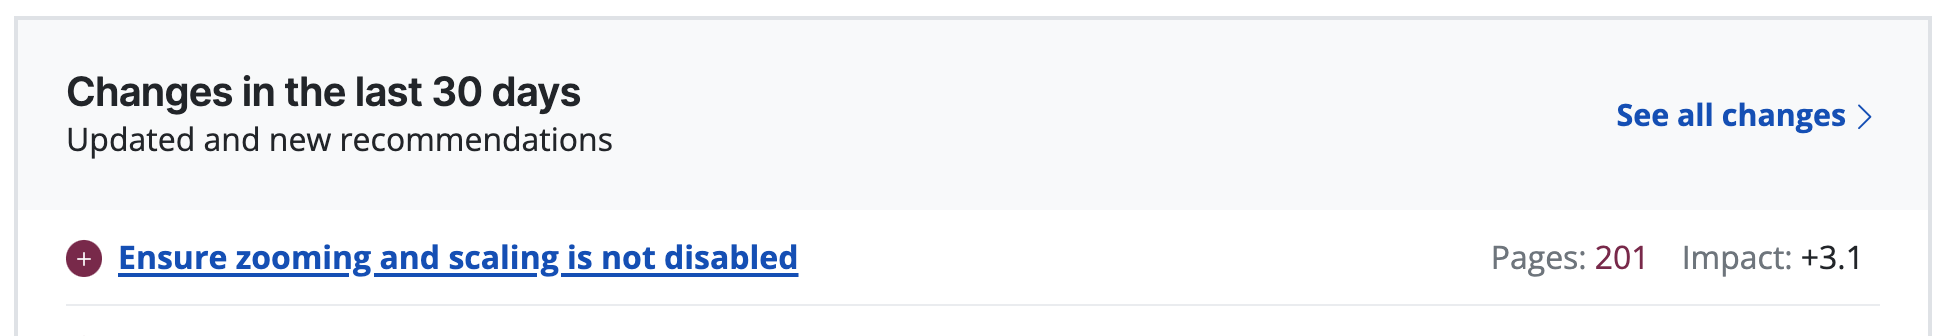
- The “Changes in the last 30 days” section in this tab displays new and resolved recommendations. To find the rest of the data, click the “See all changes” link to navigate to the Automated Scanning History page.
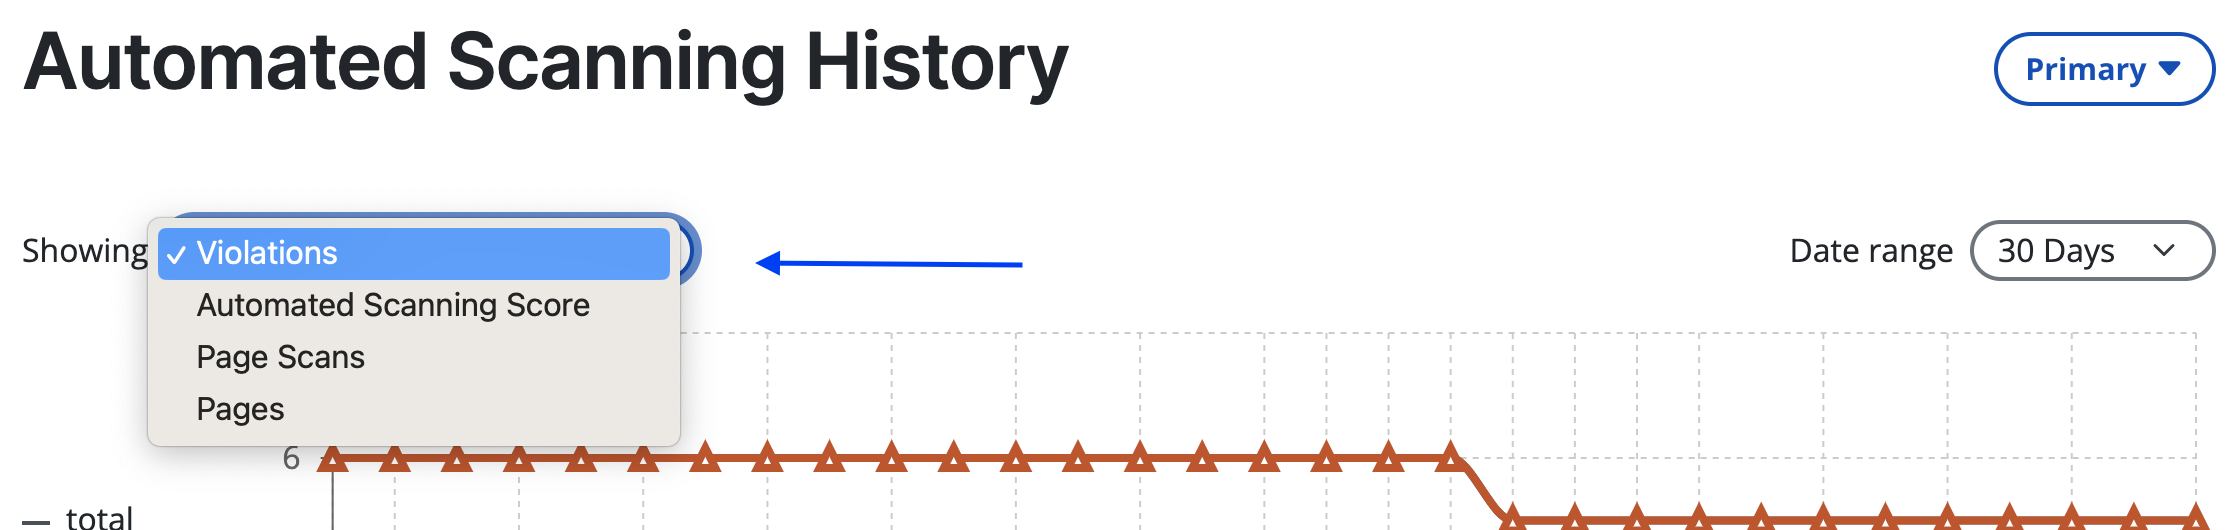
- Once on the Automated Scanning History page, choose the type of chart and date range you’d like to analyze.
- Once you’ve chosen a chart, select the data point you want to compare. This will show you all the events that happened since the previous data point.
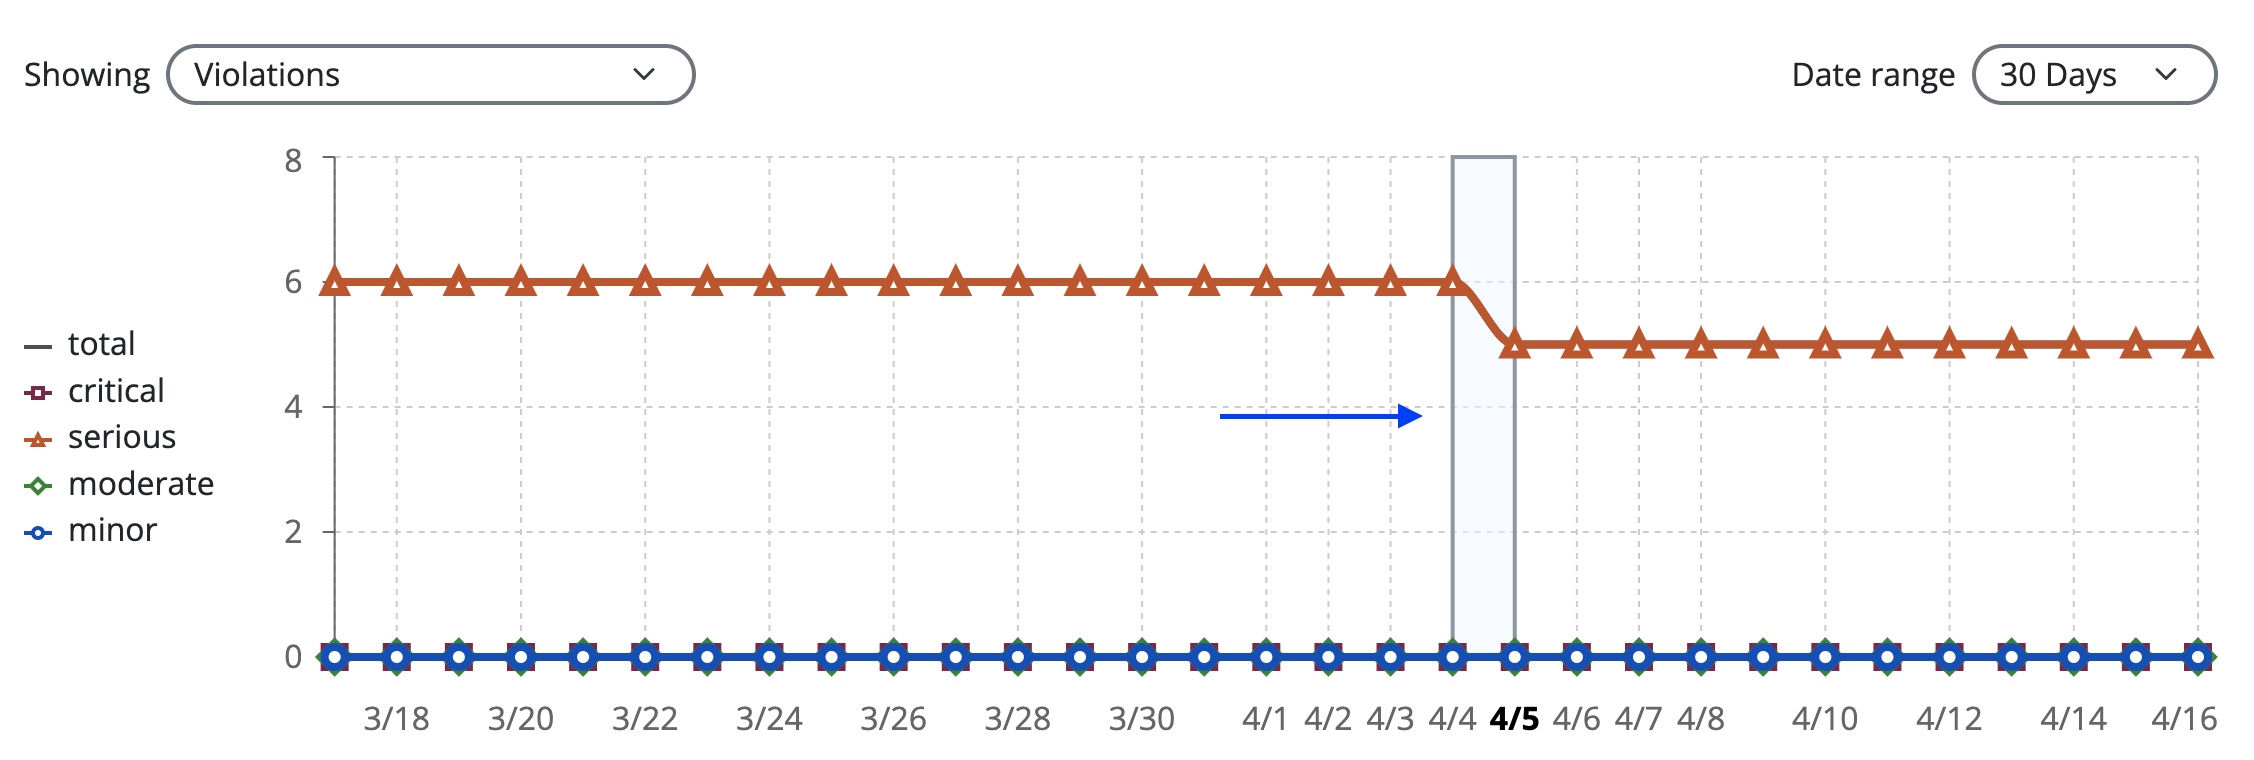
- You can do so in one of 3 ways.
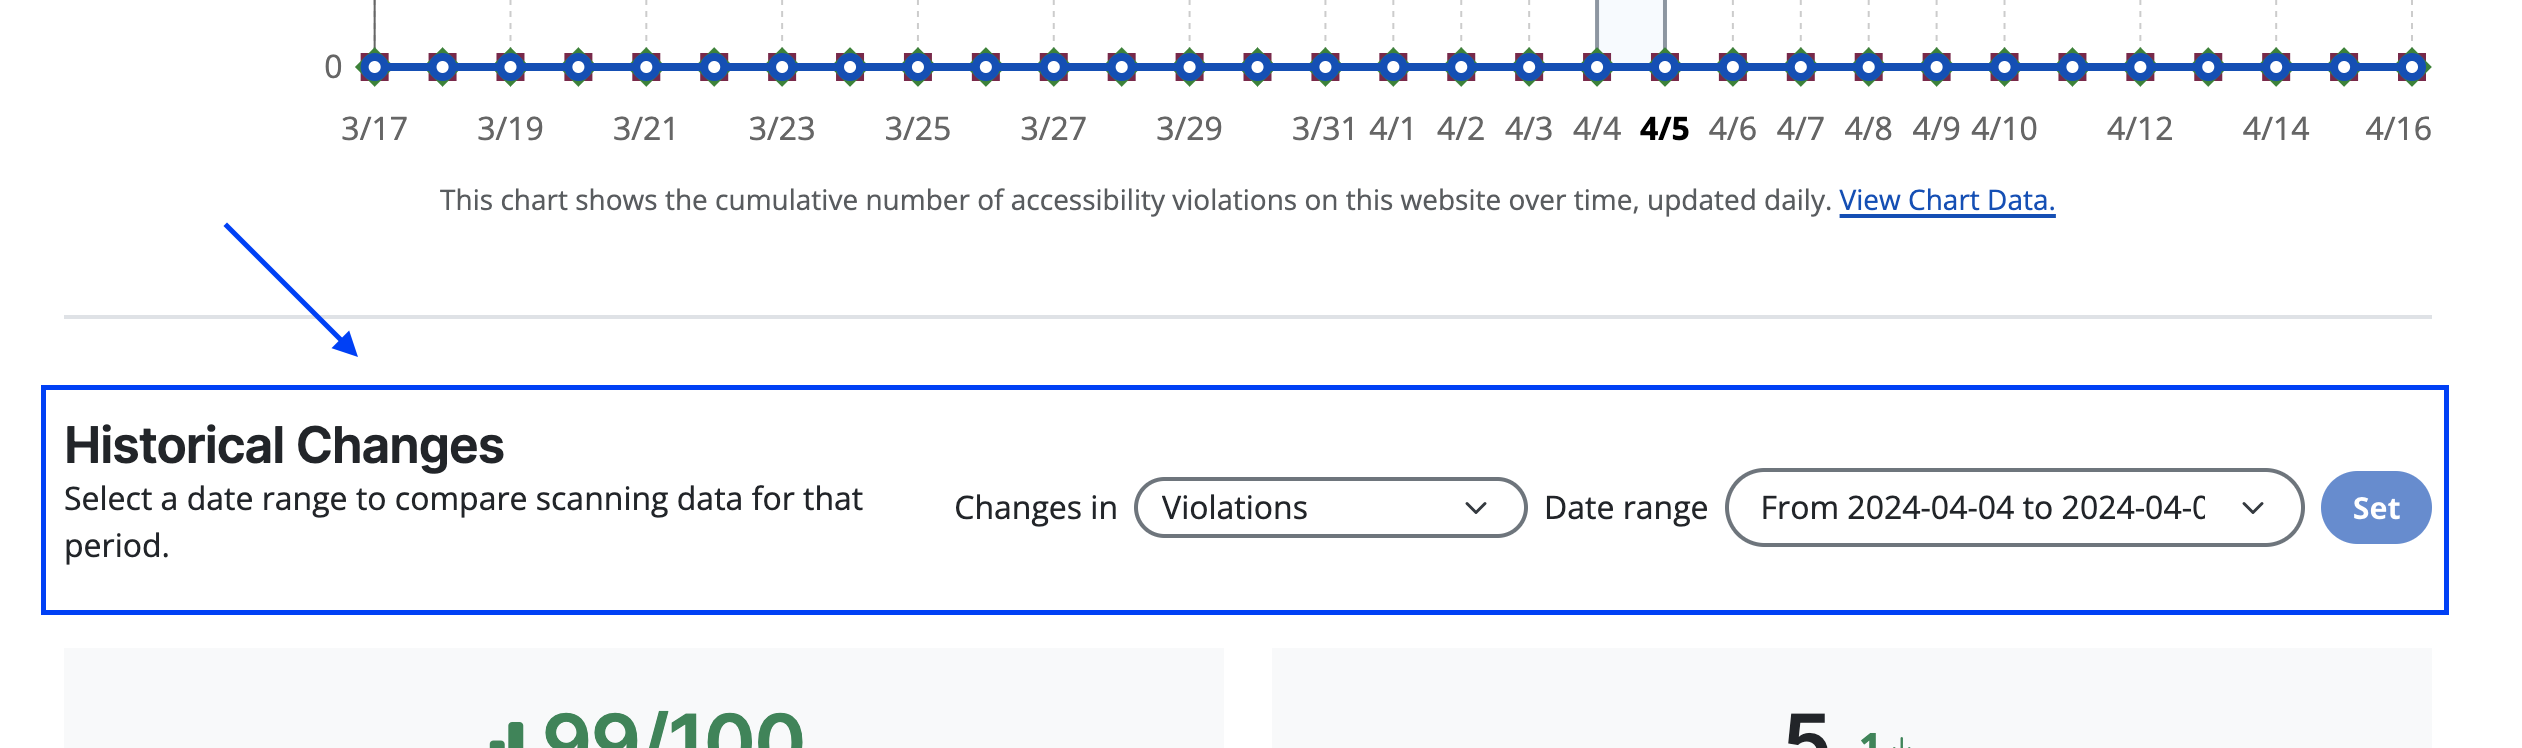
- Click on any data point on the chart,
- Click on a date on the x-axis of the chart, or
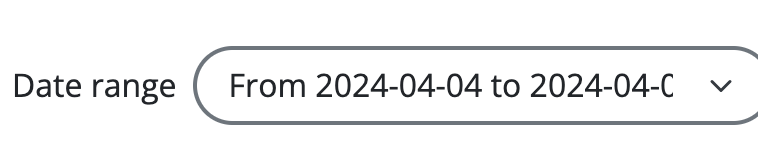
- Set a date range below the chart.
- Select the type of events you wish to display in the “Historical Changes” section below the chart. You can choose between violations and recommendations.
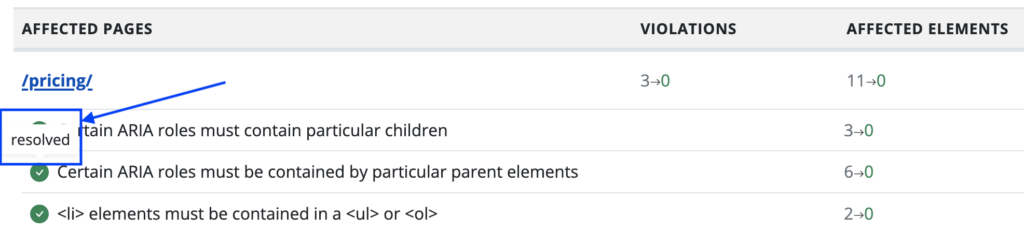
- Once the events are displayed, hover over their icons to see if they are new, updated, or resolved. The website’s pricing page has 3 resolved violations in the example below. The table shows the number of violations and affected elements that pertained to the page on those days.
From the Automated Scanning tab
- Select the website you wish to analyze and navigate to its Automated Scanning tab.
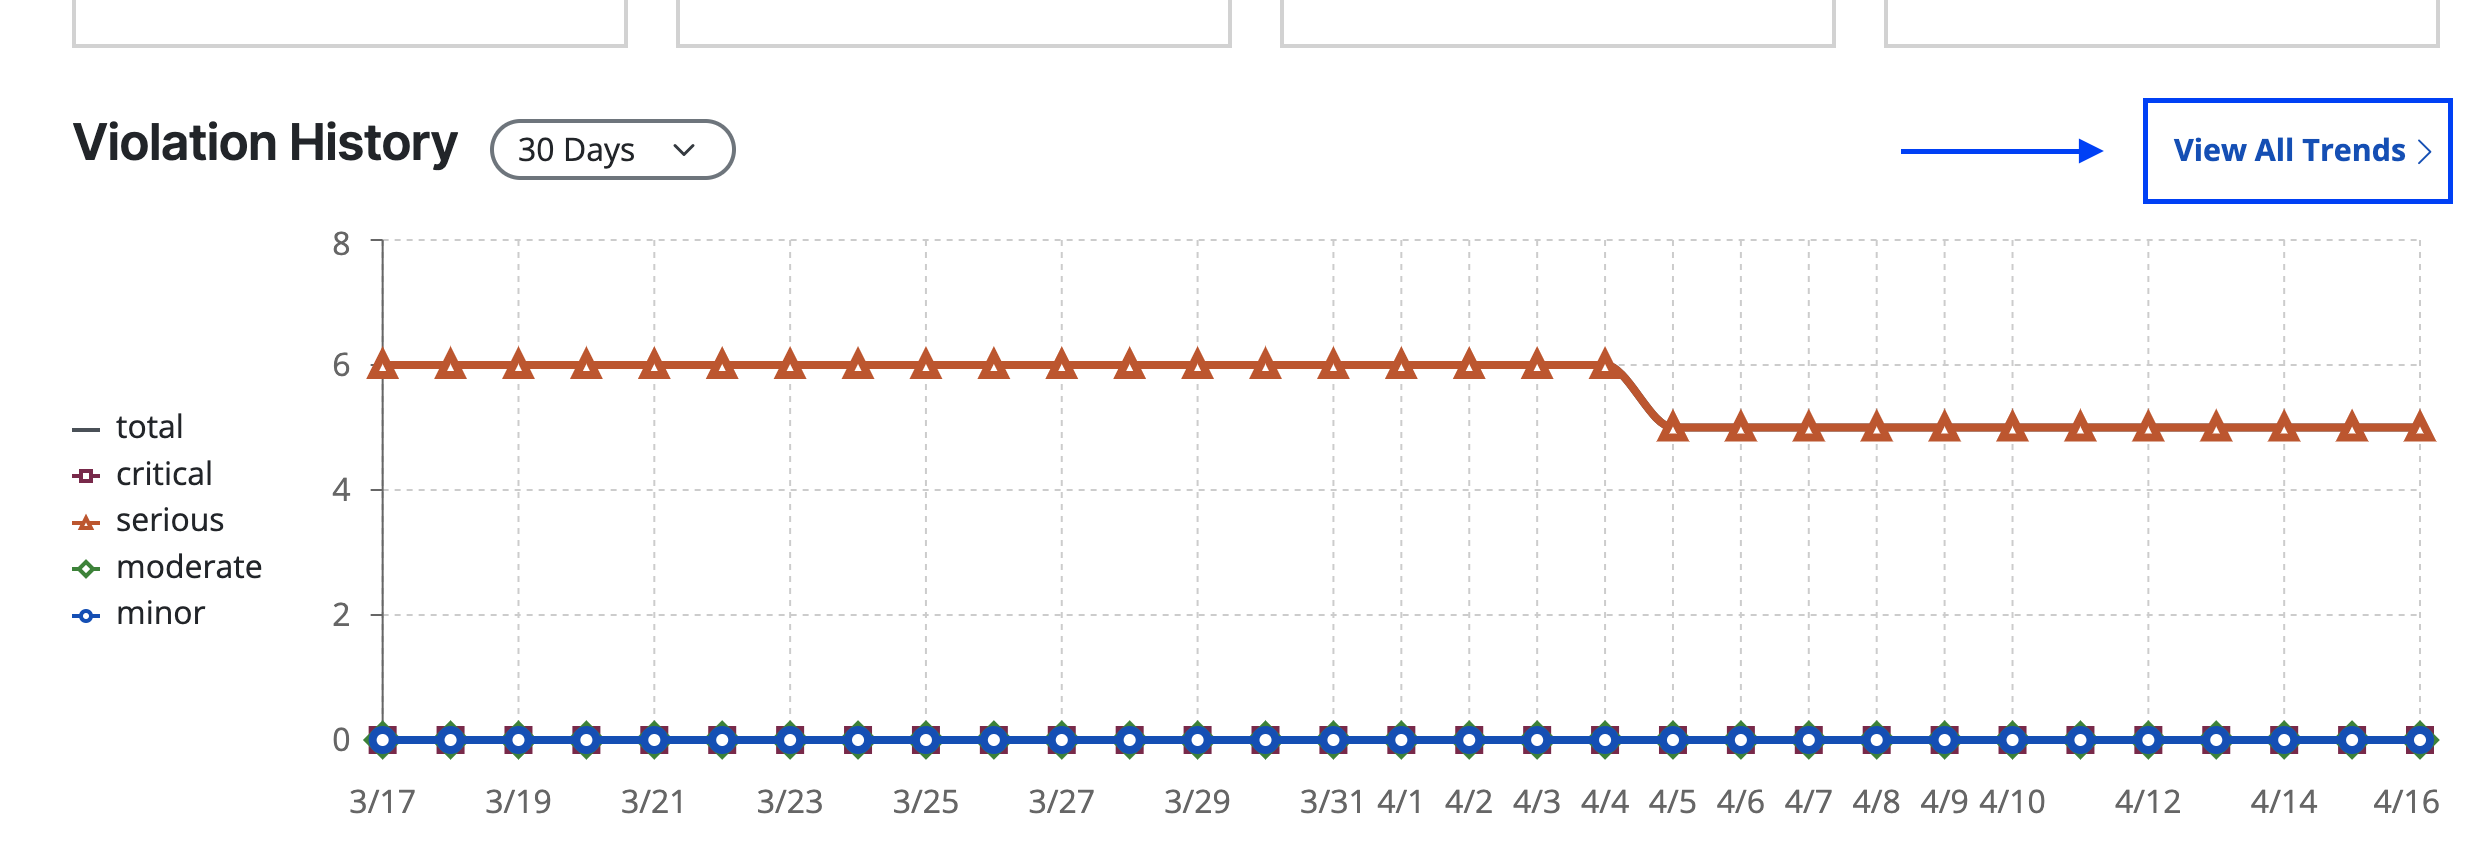
- Click the “View all trends” link in the chart section.
- Repeat steps 3-6 from above.